Review: Key Aroma-Active Components in Roast Mutton

Summary
This study identifies 24 odor-active compounds (OAV > 1) in mutton skewers roasted at 200 °C for 6 min. A model aroma built from them matched the real meat on all six sensory attributes. The data are useful, but the reporting has inconsistencies that limit how far the numbers can be trusted as published.
Citation: Xie Y., Zhang Y., Qi W., Zhang Y., Zhou G., Liu D. (2026). Characterization of key aroma-active components in roast mutton: Integration of GC-IMS, GC–MS, and aroma recombination. Food Chemistry: X 36, 103893.doi:10.1016/j.fochx.2026.103893. Bohai University, Jinzhou, China. Open access (CC BY-NC-ND).
Aim: follow how mutton aroma develops over 0–10 min of roasting, find the key odorants, and confirm them by recombination.
Design:
- Roast skewers for 0, 2, 4, 6, 8 and 10 min and pick the best time from moisture, texture, e-nose and e-tongue data.
- Track volatiles over roasting time with HS-GC-IMS and PCA (44 compounds).
- Identify volatiles at the chosen time with two extractions, HS-SPME and SAFE, both followed by GC–MS (71 compounds).
- Rank compounds by odor activity value (OAV = concentration ÷ odor threshold) and quantify the 24 with OAV > 1 using external standards.
- Recombine the 24 in triacetin and compare against the real meat with a trained panel.
Headline findings: 6 min was optimal. Hexanal, nonanal, (E,E)-2,4-decadienal, octanal, heptanal, (E)-2-nonenal and 3-methylbutanal dominate. The aroma is mainly fatty and grassy aldehydes from lipid oxidation, plus Strecker aldehydes and 2-pentylfuran.
Cooking method and best condition
The best condition was 6 min at 200 °C, chosen because the meat was most tender at that point.
- Meat: 6-month-old Sunite sheep (30 ± 2.5 kg) from Xilingol League, Inner Mongolia. Stored at −80 °C and thawed to a core temperature of −3 to −5 °C before use.
- Cooking: uniform cubes, four per skewer, roasted in air at 200 °C for 0, 2, 4, 6, 8 or 10 min, then frozen in liquid nitrogen and ground.
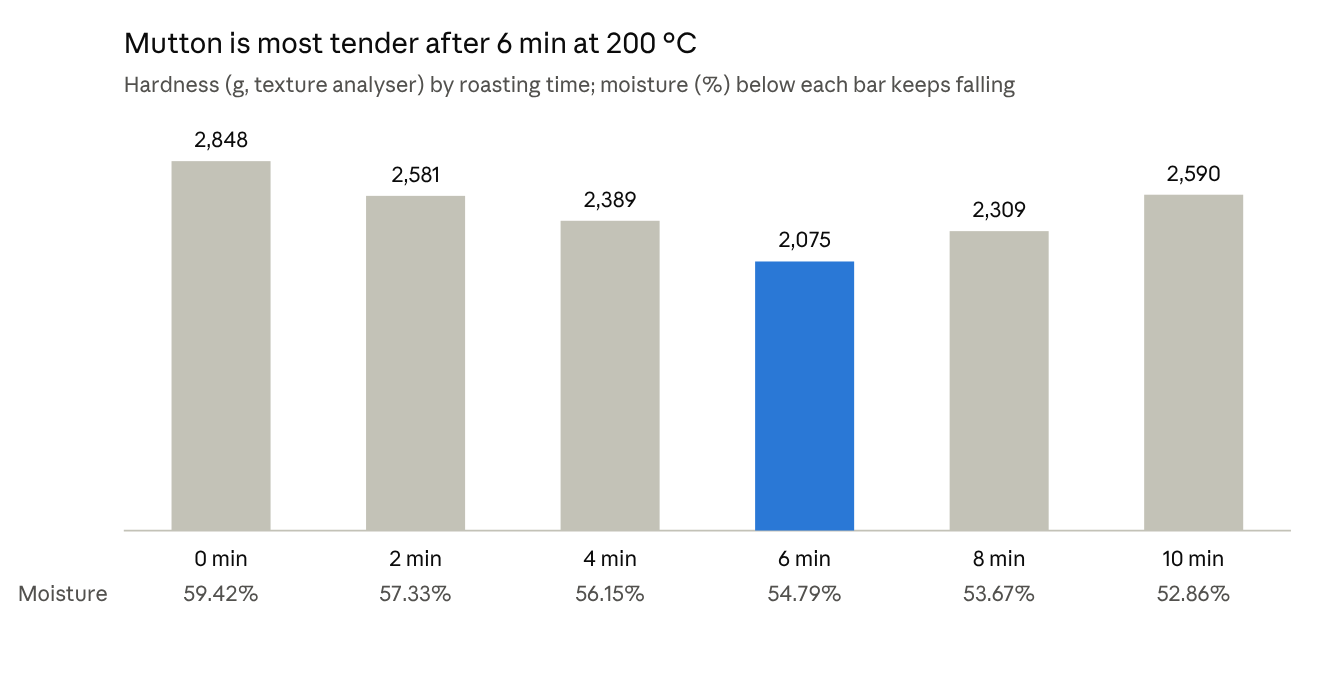
Xie et al. 2026, Table 2 · hardness and moisture, 0–10 min at 200 °C
Hardness, gumminess and chewiness all dropped to their lowest at 6 min, then rose again as the meat kept drying out. GC-IMS showed most aldehydes and alcohols peaking at 6 min. Pyrazines such as 2,5-dimethylpyrazine and 2-methylpyrazine only appeared at 10 min. The e-nose separated all six roasting times, with 97.5% of variance in the first two components.
Key aroma compounds at 6 min
Of 71 volatiles detected (31 by HS-SPME, 53 by SAFE, 13 by both), 24 have OAV > 1, and 16 of those are carbonyls. The table combines the paper's Table 3 (thresholds and OAVs) and Table 4 (concentrations by external standard). Rows are sorted by highest OAV. SPME/FD means the compound was converted to a PFBHA derivative on the fiber before GC-triple-quad MS.
Compound |
Threshold (ng/g) |
OAV, SPME |
OAV, SAFE |
Concentration (ng/g) |
Quant. method |
Odor |
(E,E)-2,4-Decadienal |
0.027 |
– |
446.2 |
49.55 ± 6.66 |
SPME/FD |
greasy, fried |
Hexanal |
2.4 |
342.1 |
87.5 |
4318.41 ± 222.38 |
SPME/FD |
grassy, fatty |
Nonanal |
2.8 |
265.6 |
56.1 |
1061.67 ± 84.27 |
SPME/FD |
fatty, grassy |
(E)-2-Nonenal |
0.25 |
26.9 |
104.3 |
86.15 ± 25.02 |
SPME/FD |
oily, green |
Octanal |
3.4 |
86.0 |
13.3 |
370.55 ± 54.22 |
SPME/FD |
fresh fruity, citrus |
Heptanal |
3 |
72.5 |
– |
591.27 ± 46.52 |
SPME/FD |
citrus, fatty |
3-Methylbutanal |
0.5 |
50.9 |
– |
4.86 ± 0.68 |
SPME/FD |
nutty, burnt |
2-Pentylfuran |
6 |
23.2 |
– |
113.62 ± 6.64 |
SPME |
nutty, roasted |
Ethyl hexanoate |
1.2 |
22.2 |
– |
91.58 ± 3.68 |
SPME |
fruity, pineapple |
1-Heptanol |
200 |
16.3 |
– |
301.66 ± 29.65 |
SPME |
fruity, soapy |
(E)-2-Octen-1-ol |
40 |
– |
15.9 |
132.88 ± 3.86 |
SAFE |
green leaf, light fat |
2-Methylbutanal |
1.5 |
11.7 |
– |
4.37 ± 0.84 |
SPME/FD |
fruity, sweet |
Dodecanal |
2 |
11.6 |
– |
4.39 ± 0.49 |
SPME/FD |
fatty, waxy |
(E)-2-Decenal |
0.4 |
7.5 |
– |
40.25 ± 4.93 |
SPME/FD |
fatty, green |
Decanal |
3 |
6.6 |
7.2 |
7.8 ± 0.83 |
SPME/FD |
soapy, citrus |
(E)-2-Octenal |
4 |
4.8 |
6.1 |
137.48 ± 15.85 |
SPME/FD |
fatty, nutty |
Pentanal |
8 |
5.4 |
4.1 |
706.58 ± 57.67 |
SPME/FD |
slightly fruity, oily |
1-Octen-3-ol |
45 |
4.1 |
1.1 |
432.75 ± 11.95 |
SPME |
mushroom |
Phenylacetaldehyde |
5.2 |
– |
2.4 |
95.45 ± 8.5 |
SPME/FD |
floral, honey |
Acetoin |
55 |
– |
2.1 |
97.29 ± 5.31 |
SAFE |
buttery |
Ethyl octanoate |
8.7 |
1.7 |
– |
92.98 ± 7.63 |
SPME |
fruity, green |
(E)-2-Heptenal |
13 |
– |
1.2 |
161.09 ± 22.43 |
SPME/FD |
green apple, bitter almond |
1-Octanol |
110 |
1.1 |
– |
236.79 ± 44.39 |
SPME |
green fruity |
Benzothiazole |
25 |
– |
1.1 |
183.04 ± 10.42 |
SAFE |
smoky |
Thresholds were taken from the Leibniz-LSB@TUM Odorant Database; the paper does not say which matrix (water, oil or air) each threshold refers to. A dash means the compound was not detected by that extraction. The OAVs are semi-quantitative and were not recalculated from the Table 4 concentrations (see Weaknesses).
Aroma recombination
A model of all 24 OAV > 1 compounds in triacetin matched the real 6-min roast mutton: t-tests on all six attributes gave P > 0.05.
- Recipe: the 24 compounds in the table above, in odorless triacetin (glycerol triacetate). The paper gives no separate recipe table. It implies the Table 4 concentrations were used, but does not say so explicitly.
- Panel: 30 people were screened and 10 trained assessors (6 women, 4 men) were kept, trained to ISO 4121:2003. Samples were reheated to a 35 °C core temperature, and assessors sniffed coffee beans between samples.
- Attributes: meaty, fatty, muttony, roasted, grassy and sweet, each on a 0–5 intensity scale.
- Result: read by eye from Fig. 8, meaty, fatty and roasted were strongest (about 3–4). Grassy, sweet and muttony were weak (about 1–1.5). The real meat was slightly higher on meaty and fatty. The authors also say the model "scored a solid 4.5 out of 5", but don't explain what that score is.
- Not done: no omission tests, so the paper doesn't show which of the 24 compounds are actually needed.
The muttony note being weak in both samples matters. The branched-chain fatty acids usually linked to sheep odor, such as 4-methyloctanoic and 4-ethyloctanoic acid, are not among the 24 compounds. With neither sample smelling clearly of mutton, the test can't show whether the model captures that note.
Strengths
- Time course with a practical endpoint. Choosing 6 min from texture, moisture, e-nose and e-tongue data ties the chemistry to a condition a cook or processor can reproduce.
- Two complementary extractions. HS-SPME favored volatile aldehydes, while SAFE recovered acids, esters and less volatile compounds. Together they found 71 compounds, against 31 or 53 for either alone. Only SAFE caught (E,E)-2,4-decadienal, the compound with the highest OAV.
- Carbonyl derivatization. On-fiber PFBHA derivatization with GC-triple-quad MS is a sound way to measure reactive, low-level aldehydes.
- External-standard calibration. All 24 key compounds have calibration curves with R² of 0.982–0.999, better than relying on internal-standard area ratios alone.
- Sensory closure. The recombination test with t-tests links the instrument data back to perception.
- Consistent with earlier work. The key aldehydes, 1-octen-3-ol and 2-pentylfuran match earlier roast-mutton studies (e.g. Liu et al., Foods 2021), which adds confidence in the identifications.
Weaknesses and concerns
The most serious problem is that the paper's two concentration sources disagree, and its OAVs are never recalculated from the final concentrations.
- OAVs and concentrations don't match.
- Hexanal: the OAV of 342.1 × a threshold of 2.4 ng/g gives about 821 ng/g, which matches the 821.02 ng/g in the text. Table 4, however, gives 4318 ng/g, about 5× higher.
- 3-Methylbutanal: the OAV of 50.9 implies about 25 ng/g, but Table 4 gives 4.86 ng/g, which would mean an OAV of about 10.
- The paper never says which numbers fed the recombination model or how the compound ranking would change.
- No recipe is published. The amount of each compound in the model is only implied, so others cannot reproduce it exactly.
- No GC-O or AEDA. Key odorants were picked by OAV alone, with no sniffing step. Odorants with unknown thresholds, or below the GC–MS detection limit, could be missed, notably sulfur compounds such as methional and 2-methyl-3-furanthiol, and pyrazines. The GC-IMS run detected methional ("3-(methylthio)propanal") and pyrazines, but neither was carried forward.
- No omission tests. Without them the paper doesn't show which of the 24 compounds matter. Adding all of them confirms the set is sufficient, not that each one is necessary.
- Mutton character is not explained. The 24 are generic cooked-meat lipid-oxidation products. The "muttony" score was low in both samples, and the branched-chain fatty acids (4-methyloctanoic, 4-ethyloctanoic) were not measured.
- The optimum is based on texture, not flavor. 6 min was chosen mainly for tenderness and moisture. GC-IMS shows peaks at both 6 and 10 min, and pyrazines only appear at 10 min, so the best time for aroma is not established.
- Methods and reporting are imprecise.
- "Bake in the air at 200 °C": the equipment, airflow, skewer size and core temperature are not stated.
- The cut is called "upper brain meat", probably a literal translation of a Chinese name for a neck/shoulder cut.
- Column dimensions are given as "30 mm" instead of 30 m.
- Concentrations by compound class are reported in ng/kg in one place and ng/g in another, and the text mentions an "SDE" method that was never used.
- The panel is 10 people in one place and 9 in another, and "5 descriptors" in one place against six attributes elsewhere.
- The texture data have inconsistent significance letters (hardness at 10 min is labeled "e").
- No replication across animals. Meat came from one supplier, with no stated number of animals or batches, so variation between animals is unknown.
- Statistics are thin. Only t-tests were used for the sensory comparison, with no power calculation. Concluding the samples are the same from P > 0.05 with 10 assessors is weak evidence. An equivalence test or triangle test would be stronger.
Overall assessment
This is a useful descriptive dataset for the aldehyde-driven fatty and grassy backbone of roast mutton aroma. It is not yet a validated key-odorant study. The list of compounds is credible and agrees with earlier work. The concentrations, the OAV ranking and the recombination recipe need checking before anyone builds on them.
For anyone using the data, such as building a roast mutton flavor:
- Use the Table 4 concentrations as the starting point, since they come from calibrated external-standard curves. Recalculate OAVs from them, keeping in mind the threshold matrix is unknown.
- Expect the 24-compound blend to give fatty, grassy and roasted-meat notes but little true mutton character. Branched-chain fatty acids (4-methyloctanoic, 4-ethyloctanoic) and sulfur and pyrazine compounds are likely needed for the full profile.
- Treat 6 min at 200 °C as the optimum for texture. The best aroma may come with longer roasting, when pyrazines form.
Questions for the authors:
- ☐ Which concentrations were dosed into the triacetin model?
- ☐ Why do the OAVs in Table 3 disagree with the Table 4 concentrations?
- ☐ What matrix (water, oil or air) does each threshold refer to?
- ☐ Would omission tests and GC-O change the list of key odorants?
Sources
- Xie et al. (2026), Food Chemistry: X 36, 103893:ScienceDirect·PubMed Central. Reviewed from the PDF supplied by the user.
- Liu H. et al. (2021), pre- and post-rigor roasted mutton, Foods 10, 2387:PMC8535600