FTIR Spectroscopy in Flavor Chemistry: Theory, Instrumentation, Industry Applications, and Analytical Capabilities
FTIR spectroscopy is one of the more than twenty analytical techniques that the Society of Flavor Chemists requires certified flavorists to understand.
Here is a complete reference on FTIR spectroscopy structured across all four dimensions mandated by the Society — theory, flavor industry relevance, and advantages and limitations.
Theory, function, and reporting
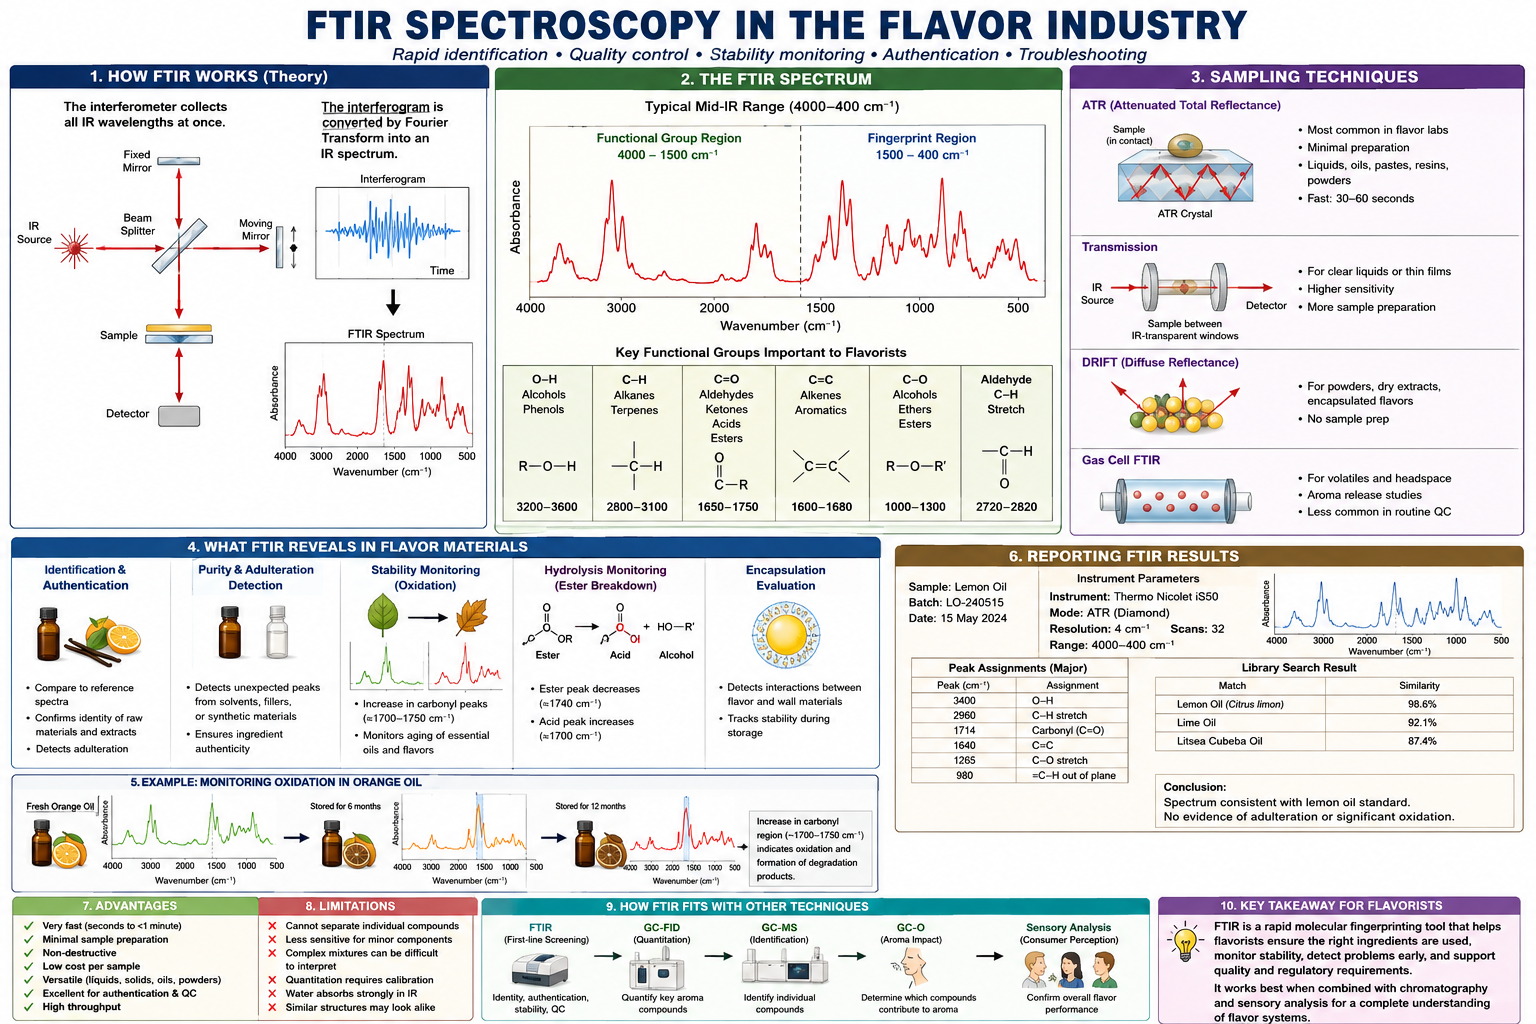
FTIR stands for Fourier Transform Infrared Spectroscopy. It works on a deceptively simple physical principle: every chemical bond in a molecule vibrates at a characteristic frequency, and when infrared radiation of that same frequency strikes the bond, the bond absorbs that energy. The absorbed frequencies form a unique pattern — a molecular fingerprint — that identifies what bonds and functional groups are present in the sample.
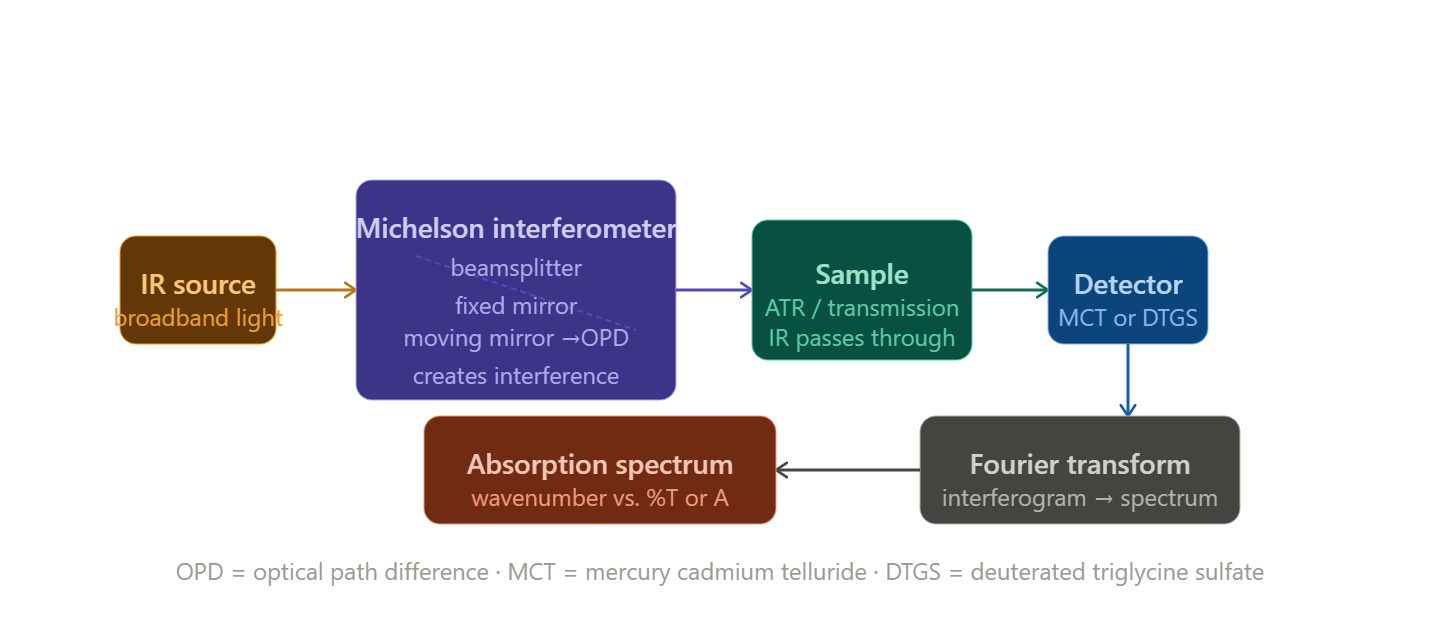
The critical innovation in FTIR compared to older dispersive infrared instruments is the Michelson interferometer. Instead of scanning one wavelength at a time, FTIR exposes the sample to all infrared wavelengths simultaneously. The moving mirror in the interferometer creates an optical path difference (OPD) that causes different wavelengths to interfere constructively and destructively at different mirror positions. The detector records this combined interference signal — called an interferogram — as a function of mirror position. Applying a Fourier transform (a mathematical operation built into the instrument's computer) then deconvolutes the interferogram into the familiar spectrum: absorption plotted against wavenumber (cm⁻¹).
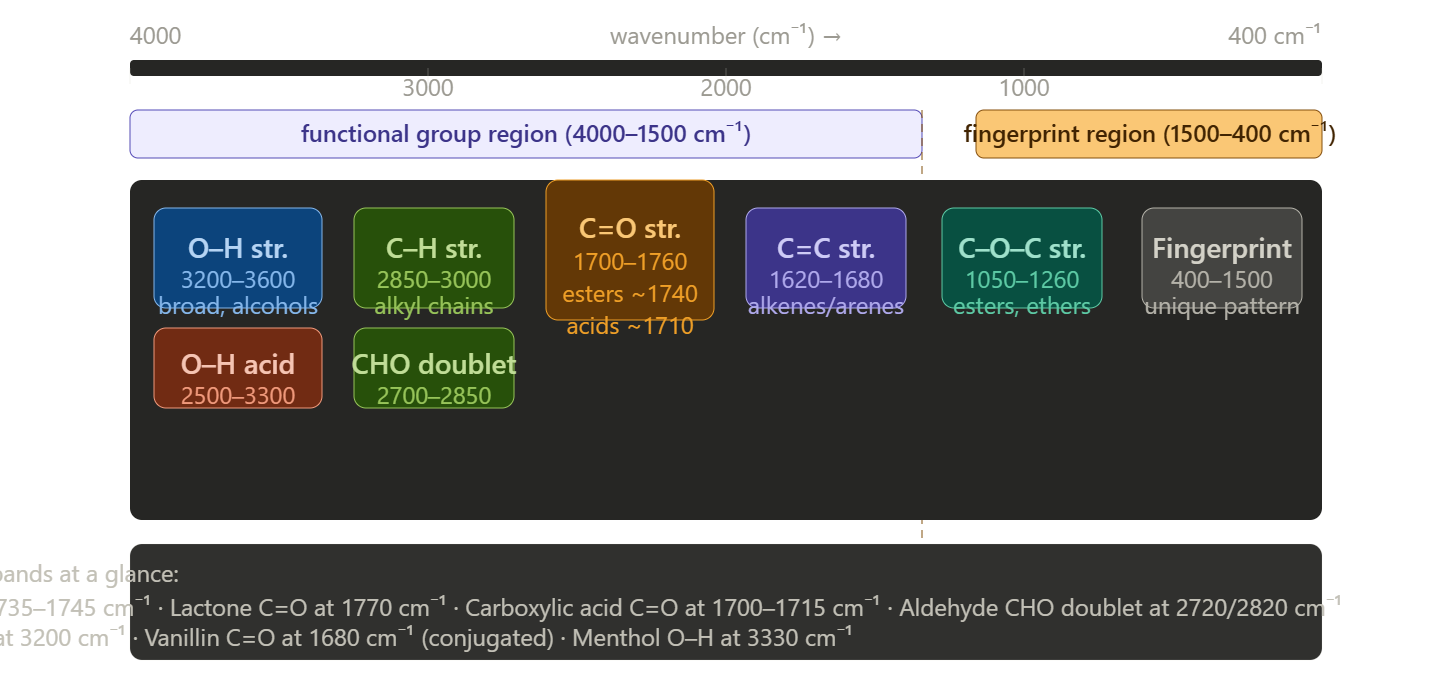
The result is a spectrum spanning roughly 4000 to 400 cm⁻¹, divided into two analytically important regions. The functional group region (4000–1500 cm⁻¹) contains peaks from specific bond stretches — O–H around 3300 cm⁻¹, C=O carbonyl near 1740 cm⁻¹, C–H stretches between 2850–3000 cm⁻¹. The fingerprint region (1500–400 cm⁻¹) contains complex overlapping bending and skeletal vibrations that are unique to each molecule, making it the most powerful zone for compound identification against reference libraries.
Reporting an FTIR analysis means providing the spectrum itself (as a plot or data table), identifying and annotating the major absorption peaks with their wavenumber positions, assigning each peak to a functional group or bond type, and — in quantitative work — reporting absorbance values at specific wavenumbers with corresponding concentrations using a Beer–Lambert calibration. Reports also document the sampling technique (ATR, transmission, diffuse reflectance), the resolution in cm⁻¹, number of scans averaged, and any spectral processing applied (baseline correction, smoothing, ATR correction for penetration depth).
Spectral fingerprint regions — what peaks mean what
Relevance to the flavor industry
FTIR is one of the most practically useful instruments in a flavor laboratory, and its relevance cuts across raw material authentication, quality control, process monitoring, and regulatory compliance.
One particularly powerful application in flavor work is the monitoring of ester hydrolysis — directly connecting to the saponification chemistry explored earlier. The ester C=O stretch at 1735–1745 cm⁻¹ is one of the strongest, sharpest, and most reliably quantifiable peaks in the entire infrared spectrum. As esters in a flavor formula hydrolyse over shelf life, this peak diminishes in a quantifiable way while the carboxylic acid C=O at 1710 cm⁻¹ grows. Tracking the ratio of these two peaks at defined time points gives a direct, chemical-level measurement of saponification progress — something that is very difficult to obtain rapidly by any other method.
Advantages and limitations
Positioning FTIR within the analytical toolkit
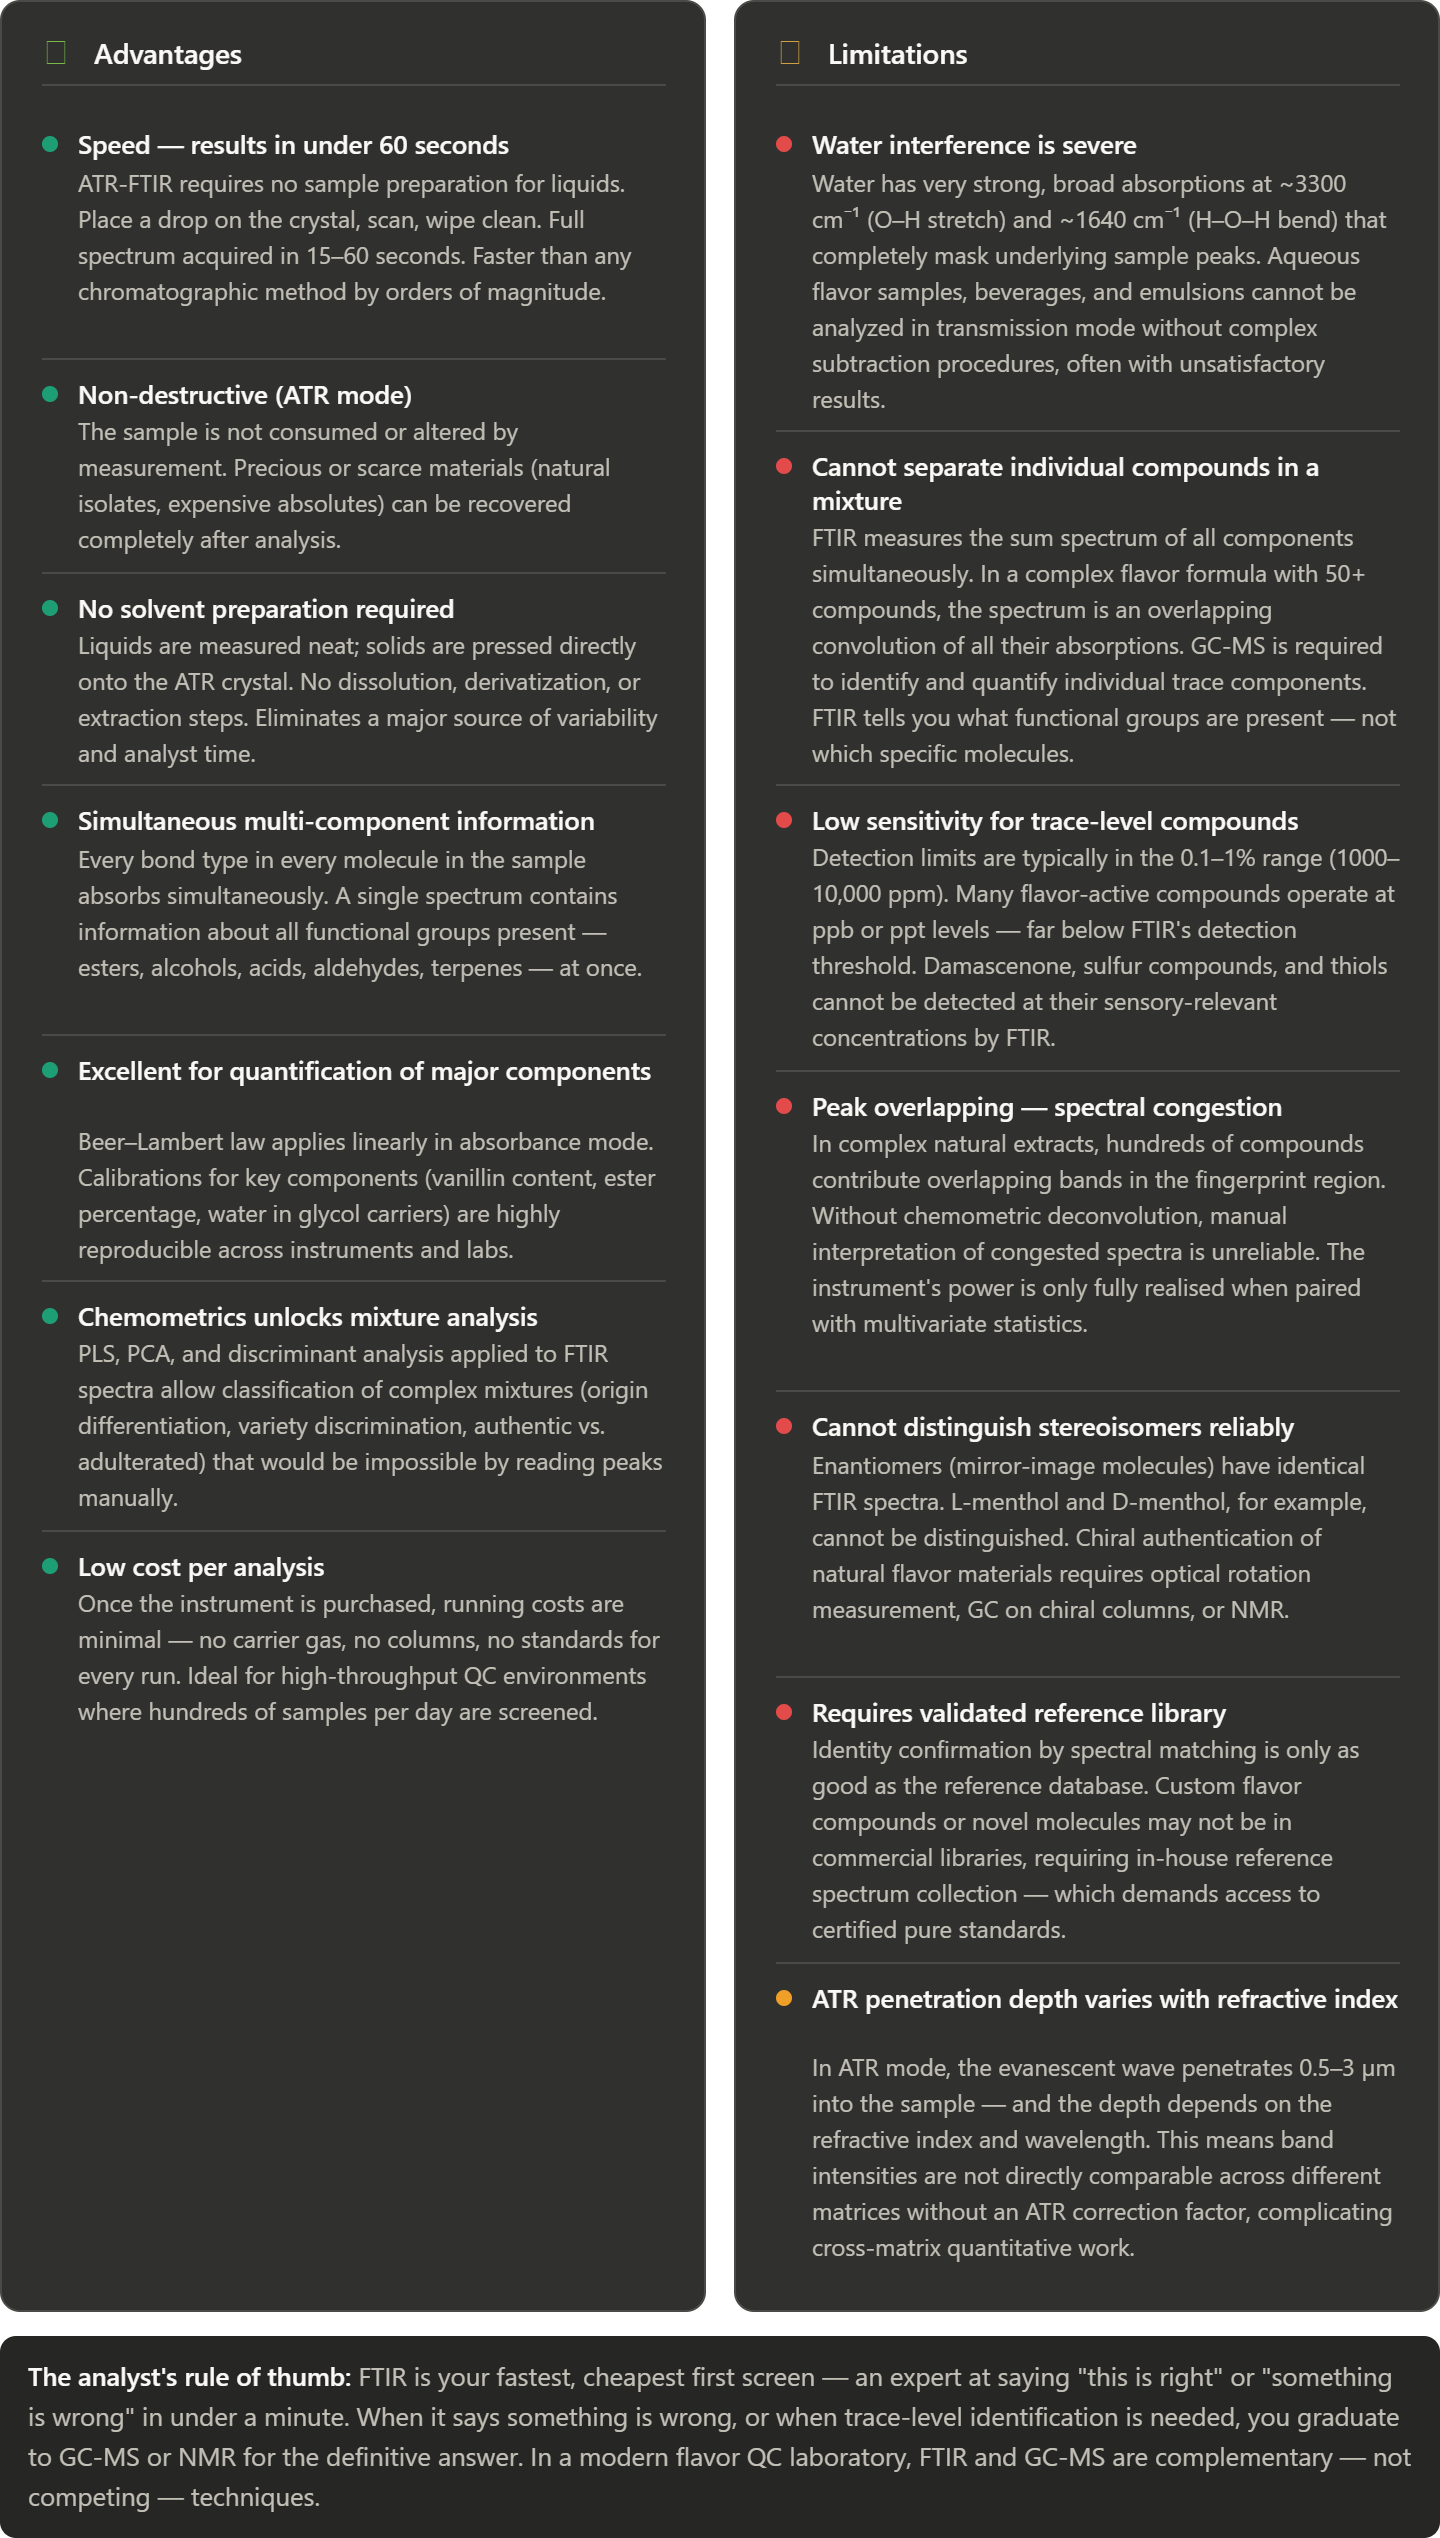
The water interference limitation deserves particular emphasis for flavor professionals. Most finished food and beverage products are primarily aqueous, and the O–H absorption of water is so enormously intense that it overwhelms nearly everything else in the spectrum. This means FTIR is most powerful on the input side — screening raw flavor materials, essential oils, aroma chemicals, carrier solvents, and flavor concentrates that are not water-based — rather than on finished product analysis. For aqueous matrices, techniques such as attenuated total reflectance with a water-subtraction protocol, or horizontal ATR with short pathlength cells, can reduce but not eliminate this problem.
The limitation around trace-level detection is equally critical in flavor applications. The most potent aroma compounds — damascenone at 0.002 ppm, thiols at sub-ppb levels, furaneol at 0.03 ppb — are present at concentrations thousands of times below FTIR's detection floor. FTIR will never tell you whether damascenone is present in your apple flavor at 0.002 ppm. GC-MS with a selective detector (FID, FPD, or ideally a mass spectrometer operating in SIM mode) is the only appropriate tool for that question.
What makes FTIR irreplaceable is the combination of speed, no sample prep, non-destruction, and functional group breadth. No other technique gives you a complete molecular functional group map of a sample in under a minute at near-zero running cost. For incoming QC, authenticity screening, and the specific application of tracking ester hydrolysis over shelf life, it is one of the highest-value instruments a flavor laboratory can operate.
###