Turbidity Measurement in the Flavor Industry: Principles, Applications, and Critical Evaluation
Turbidity meter is one of the instruments the Society of Flavor Chemists require certified flavorists to understand and use.
"Turbidity Measurement in the Flavor Industry: Principles, Applications, and Critical Evaluation"
Theory, Function, and Reporting of the Method/Device
Here is a concise description of the theory, function, and reporting for a turbidity meter (nephelometer), based on standard methods (e.g., EPA 180.1, ISO 7027).
1. Theory
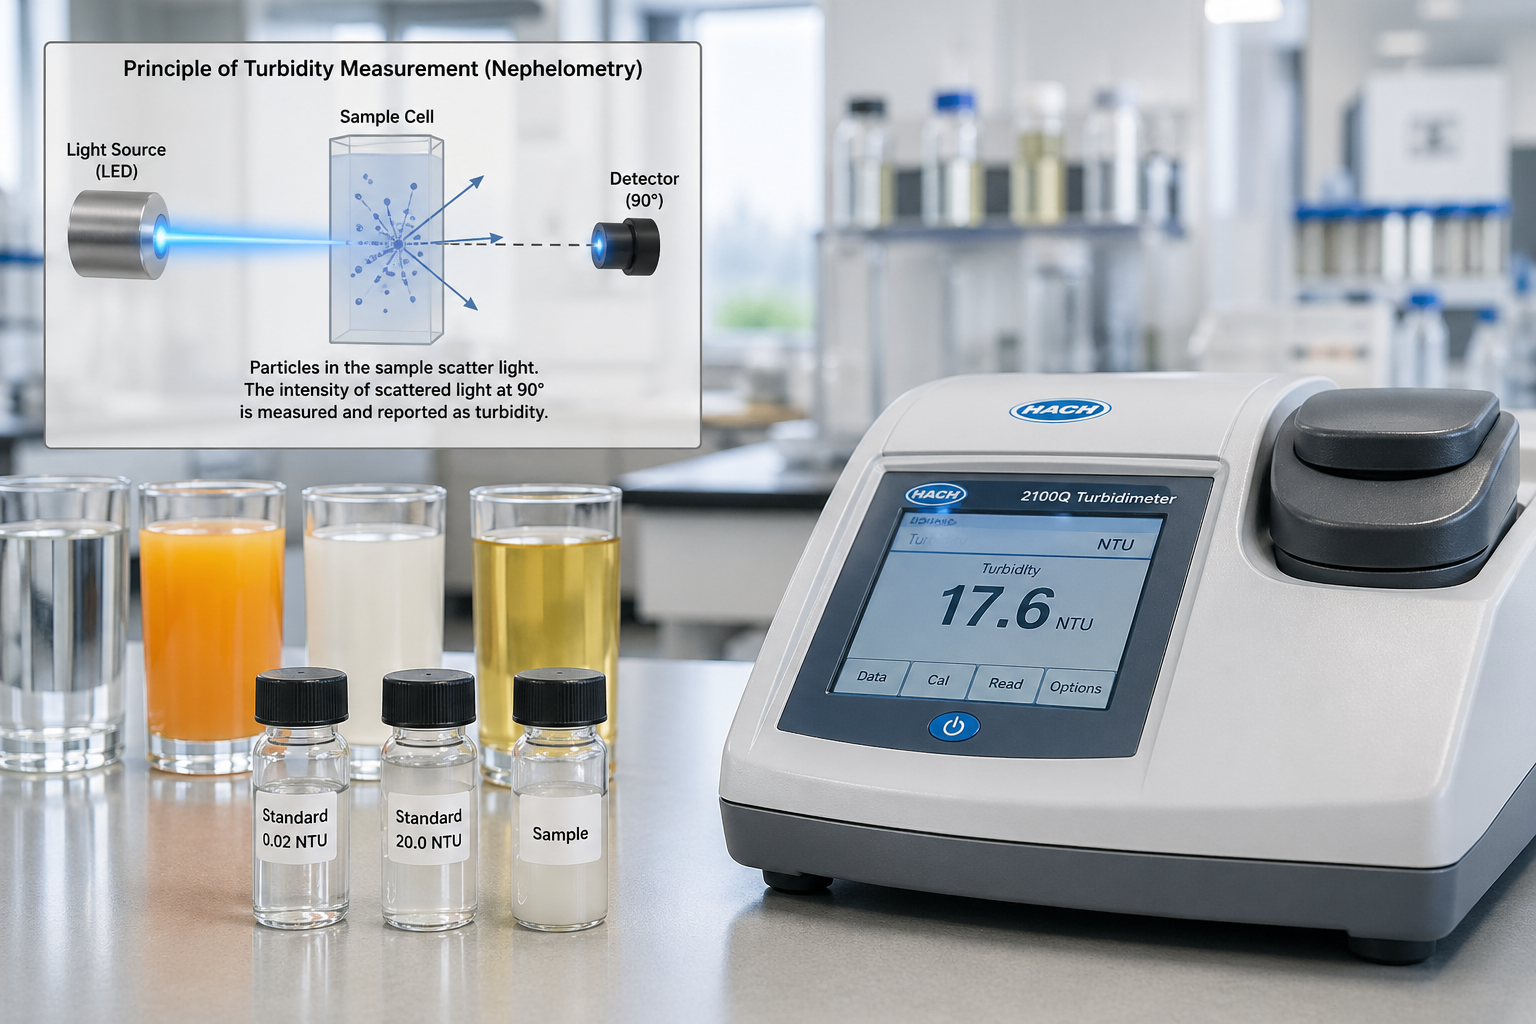
Turbidity meters operate on the principle of nephelometry – the measurement of light scattered by suspended particles in a liquid.
- Light Scattering: When a beam of light passes through a water sample, particles (clay, silt, algae, microorganisms) cause the light to scatter in all directions.
- Relationship: The intensity of scattered light is proportional to the concentration of suspended particles, provided the particles are of similar size, shape, and refractive index.
- Key Measurement Angle: Most regulatory methods measure scattered light at a 90° angle to the incident beam. This angle minimizes interference from light transmitted directly through the sample or from particle color/absorption.
- Reference Standard: Formazin polymer is the primary calibration standard, defined in Nephelometric Turbidity Units (NTU).
2. Function
The meter quantifies turbidity through the following steps:
- Light Source: A tungsten-filament lamp (EPA 180.1) or infrared LED (ISO 7027) emits a focused beam into the sample cell.
- Sample Chamber: A glass or plastic vial containing the water sample is placed in the light path.
- Detector: A photodetector, positioned at 90° to the light source, measures the intensity of scattered light.
- Signal Processing: The detector converts light intensity into an electrical signal. The meter compares this signal to calibration curves stored in memory (based on Formazin standards) and displays the result as a numeric turbidity value.
- Compensation Features: Modern meters include:
- Automatic range selection.
- Temperature compensation.
- Air bubble rejection algorithms.
- Correction for color or light-absorbing particles (via ratio measurement using additional detectors).
3. Reporting (Method & Device)
Proper reporting includes both the numeric value and essential metadata for data quality and comparability.
A. Units of Measurement
- NTU (Nephelometric Turbidity Units) – for measurements made per EPA 180.1 (white light).
- FNU (Formazin Nephelometric Units) – for measurements per ISO 7027 (infrared light, often used in field or colored samples).
- Note: For most drinking water applications, 1 NTU ≈ 1 FNU, but they are not interchangeable for regulatory reporting.
B. Reporting Format and Precision
| Turbidity Range | Recommended Precision | Example Report |
|---|---|---|
| < 1.0 NTU | 0.01 or 0.001 NTU | 0.23 NTU |
| 1.0 – 10 NTU | 0.1 NTU | 3.5 NTU |
| > 10 NTU | 1 NTU | 45 NTU |
C. Required Report Elements (per Standard Methods)
- Numerical value with units (NTU or FNU).
- Instrument make/model and calibration date.
- Calibration standard used (e.g., Formazin, StablCal).
- Sample temperature (if critical).
- Any dilution factor (if sample exceeded range).
- Method reference (e.g., EPA 180.1, SM 2130B, ISO 7027).
D. Quality Control Reporting
Report should include:
- Blank reading (e.g., < 0.05 NTU).
- Calibration verification result (e.g., 10.0 NTU standard read 10.2 NTU, ±2%).
- Duplicate sample precision (e.g., relative percent difference < 10%).
Example Report Line:
Turbidity: 0.34 NTU (Hach 2100Q, EPA 180.1, calibrated 12-Jan-2026 with StablCal, blank = 0.02 NTU).
Relevance to the Flavor Industry
Turbidity measurement is highly relevant to the flavor industry because the visual clarity of a liquid is the consumer's first quality check, directly influencing their perception of taste, safety, and overall product desirability . The primary role of a turbidity meter in this industry is to provide an objective, quantifiable measurement of haze or cloudiness, which is used to control quality during production and to confirm the final product meets its distinct visual standards .
Here are the key ways turbidity measurement is applied across different sectors of the flavor and beverage industry.
👁️ Consumer Perception and Quality Control
Clarity is a critical component of quality. For many beverages, a clear, bright appearance signals purity, stability, and a high-quality product . Turbidity is used to ensure products meet these expectations.
However, the "ideal" level of turbidity varies by product, and turbidity meters help producers hit their specific target, whether that's near-zero clarity or a deliberately hazy appearance .
- Clear Beverages: For products like filtered beers (e.g., Pilsners, Ambers), wines, and many fruit juices, low turbidity is essential. For instance, wines bottled for immediate consumption often require a clarity of less than 1.0 NTU (Nephelometric Turbidity Units) .
- Deliberately Hazy Products: In other cases, turbidity is a desired trait. The popularity of hazy styles like New England IPA (NEIPA) means that higher turbidity is a marker of authenticity and a specific flavor profile. Turbidity levels for different beer styles can vary dramatically :
- Pilsner: Very low turbidity (~1.4 FTU)
- Amber: Slight haze (~38.5 FTU)
- Wheat Beer: Hazy and opaque (~234.2 FTU)
- NEIPA: Very high turbidity (~370.3 FTU)
- Perceived Quality in Juices: A certain level of haze in fruit juices can be desirable, as consumers may associate it with higher nutritional value, freshness, and less processing .
⚙️ Process Monitoring and Optimization
Beyond the final product, turbidity meters are essential tools for monitoring and controlling the production process itself. They enable real-time adjustments that save time, reduce waste, and ensure consistency .
- Brewing: Turbidity changes throughout the brewing process. It starts relatively low during the wort phase, increases significantly during fermentation and dry-hopping, and then decreases during the cold-conditioning (crash) phase as particles settle out . Monitoring these changes helps brewers:
- Know when yeast has properly settled .
- Optimize the timing of centrifuge purges to remove solids without losing product. A turbidity meter can be set to trigger a purge automatically when a specific NTU level is detected, for example, between 30 and 40 NTU .
- Ensure filtration equipment is working correctly .
- Juice and Extract Production: Turbidity is monitored during the clarification of fruit juices (like pomegranate) and botanical extracts . It helps evaluate the effectiveness of processes like ultrafiltration, which removes pectin and other haze-causing colloids . In stevia extract production, turbidity removal rates of up to 97% have been achieved using flocculants to create a consumer-acceptable sweetener .
🔧 Product Development and Filtration
Turbidity is a critical parameter in research and development, especially when creating new products or refining filtration processes.
- Defining "Doneness": For products where clarity is the goal, turbidity provides a clear, numeric target for "doneness." R&D teams use turbidity measurements to determine how much filtration is needed to remove haze-forming compounds like polyphenols, waxes, and chlorophyll from botanical extracts .
- Validating Filtration: Each stage of a filtration process is validated by measuring the turbidity (in NTU) of the liquid before and after. For example, a manufacturer might record NTU values after coarse filtration, then again after winterization or depth filtration, to ensure each stage is performing as expected .
In summary, a turbidity meter serves as an objective "eye" for the flavor industry. It quantifies the first impression a consumer has of a product, enables precise control over complex production processes, and provides clear targets for product development and filtration, ensuring that a hazy IPA and a clear, crisp Pilsner each meet their distinct quality standards consistently.
Advantages and Limitations of This Method in Detail
Here is a detailed description of the advantages and limitations of using a turbidity meter (nephelometry) within the context of the flavor industry and general liquid analysis.
Advantages
Turbidity meters offer significant practical and analytical benefits over subjective visual inspection or other methods.
1. Objective, Quantitative Data
- Eliminates Human Error: Unlike visual comparison (e.g., "slightly hazy"), a turbidity meter provides a precise numerical value (e.g., 3.45 NTU). This removes operator bias, fatigue, and variations in lighting conditions.
- Enables Pass/Fail Criteria: Allows manufacturers to set exact quality thresholds (e.g., "Reject if > 0.5 NTU for filtered water").
2. High Sensitivity at Low Values
- Modern benchtop meters can detect extremely low turbidity (down to 0.0001 NTU). This is critical for clear beverages (vodka, white wine, filtered beer) where even minute haze is a product defect.
- Visual inspection typically fails below ~4 NTU, making instruments essential for premium products.
3. Real-Time Process Control (In-Line Sensors)
- Immediate Feedback: In-line turbidity meters placed in pipes provide continuous data. In a brewery, this allows for automatic valve control—purging yeast slurry only when turbidity exceeds 40 NTU, or diverting cloudy product back for refiltration.
- Reduced Sampling Delay: Eliminates the time lag of sending samples to a lab, allowing for immediate corrections.
4. Non-Destructive and Fast
- A measurement takes seconds and requires no chemical reagents. The sample remains unchanged and can be returned to the production line or used for other tests.
5. Correlation to Other Product Attributes
- In the flavor industry, turbidity often correlates with microbial stability (yeast growth), physical stability (precipitation of proteins/polyphenols), and filter efficiency. Monitoring NTU provides indirect insight into these critical parameters.
Limitations
Despite its utility, turbidity measurement has fundamental physical and practical limitations that users must understand.
1. Sensitivity to Air Bubbles (Critical Limitation)
- Problem: Turbidity meters cannot distinguish between solid particles (e.g., yeast, protein) and gas bubbles (e.g., CO₂ in beer or soda). A bubble scatters light exactly like a solid particle.
- Consequence: Freshly poured or carbonated samples will falsely read very high turbidity. For example, a stable hazy IPA might read 100 NTU, but if shaken or warm, dissolved CO₂ coming out of solution can cause a reading of 500+ NTU.
- Mitigation: Degassing samples (sonication, vacuum, or waiting) is mandatory, but this alters the sample and slows down analysis.
2. Particle Size "Blind Spot"
- Theory Limitation: Light scattering intensity is highly dependent on particle size relative to the wavelength of light (typically 400–680 nm for white light, or 860 nm for IR). Very small particles (< 0.1 µm) produce almost no scatter, while very large particles (> 10 µm) scatter light primarily forward (not detected by the 90° nephelometer).
- Practical Example: Two samples could have the same NTU value but look completely different to the naked eye. One might have many invisible sub-micron particles (turbidity meter reads low because they don't scatter well), while another has fewer but larger visible flakes (meter reads higher). The meter does not "see" the small particles well, and over-represents larger ones.
3. Interference from Sample Color or Absorbing Species
- Problem: If the liquid itself is colored (e.g., dark cola, caramel coloring, red wine), it may absorb some of the incident and scattered light before it reaches the detector.
- Consequence: The meter reads lower than true turbidity because some light energy never reaches the detector. A dark stout beer may have significant suspended yeast, but the meter shows a falsely low NTU.
- Mitigation: Use a ratio turbidimeter (measures light at 90°, 180°, and forward scatter) to mathematically compensate, or use an ISO 7027-compliant meter with 860 nm infrared light, which is less absorbed by colors.
4. Calibration Instability and Standard Issues
- Formazin Standards: The primary calibration standard (Formazin polymer) is toxic, carcinogenic, and unstable—it degrades within weeks.
- Secondary Standards: Manufacturers provide stable polymer beads (e.g., StablCal), but these do not perfectly mimic the light-scattering properties of real flavor product particles (which vary in shape, refractive index, and size distribution). This introduces systematic error.
- Cuvette Variation: Fingerprints, scratches, or slight differences in glass vials can cause errors of ±0.02 NTU or more, which is significant for ultra-clear products.
5. Inability to Identify Particle Nature
- A turbidity meter tells you how much light is scattered but not what is scattering it. Is the haze from:
- Desirable wheat protein (good for a Hefeweizen)?
- Dangerous microbial contamination (bad for any beverage)?
- An air bubble (equipment problem)?
- Consequence: A high turbidity reading triggers an investigation, but the meter alone cannot diagnose the root cause. Additional tests (microscopy, filtration, or ATP bioluminescence) are required.
6. High NTU (> 1000) Limitations
- At very high turbidities (concentrated syrups, juices, or slurry tanks), multiple scattering occurs: light bounces from particle to particle, and very little reaches the 90° detector. The meter's response becomes non-linear and may saturate.
- Mitigation: Dilute the sample with particle-free water, measure, then multiply by the dilution factor. However, dilution changes particle interactions and can introduce error.
Summary Table for the Flavor Industry
| Aspect | Advantage | Limitation |
|---|---|---|
| Speed | Result in < 5 seconds | Requires sample degassing (minutes) for carbonated beverages |
| Sensitivity | Detects 0.0001 NTU (microscopic protein) | Blind to sub-0.1 µm particles (individual flavor molecules) |
| Objectivity | Eliminates visual guesswork | Can be fooled by bubbles, color, or scratches |
| Process Use | In-line sensors enable automation | In-line sensors require regular cleaning (fouling by extracts) |
| Sample Needs | Non-destructive, small volume (10–20 mL) | Colored samples (cola, red wine) require ratio correction or IR |
| Diagnostic Value | Excellent quality control check | Cannot identify cause of haze (particle vs. bubble vs. microbe) |
Practical Takeaway for Flavor Industry Professionals
- Use turbidity meters as a screening tool, not a sole diagnostic instrument. Always confirm unexpected high readings with degassing (to rule out bubbles) and visual inspection or microscopy (to rule out microbial growth).
- Match the meter to the product: Use 860 nm IR (ISO 7027) for dark, colored liquids (cola, coffee extracts, dark beers). Use white light (EPA 180.1) for clear, colorless liquids (vodka, simple syrup, filtered water).
- Maintain rigorous cleanliness: A single fingerprint or scratch on a cuvette can create a larger error than the entire acceptable turbidity range for premium clear beverages (e.g., 0.5 NTU specification).
###